Protein Folding with Shortcut Networks
- Khor S (2016). Protein residue networks from a local search perspective. Journal of Complex Networks 4(2):245-278.
- Khor S (2017). Comparing local search paths with global search paths on protein residue networks: allosteric communication. Journal of Complex Networks 5:409-432.
- Khor S (2018). Folding with a protein's native shortcut network. Proteins: Structure, Function and Bioinformatics 86(9):924-934.
- Khor S (2020). The ND folding model. arXiv:1902.06333 version3+ Submitted.
Mixed ND models and combining ND models by chain fold type
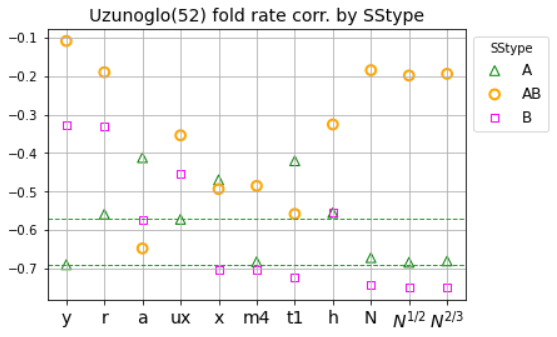
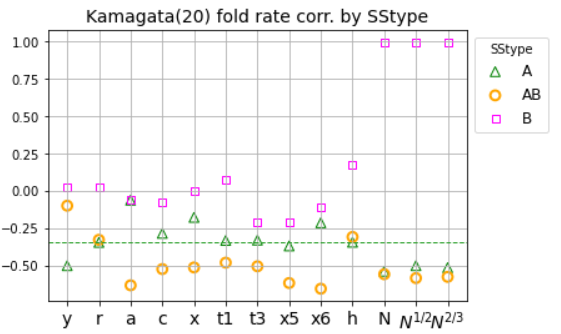
Mixed ND models adopt the simplest global node policy (uniform at random), with context-sensitive edge formation policies. E.g. different levels of unscaling may be applied to select edges by SStype or to edges incident on nodes within a certain SSneighborhood.ND results by SStype: edv=a probes previous macroscopic results (peak E corr. with exp. fold rate) by secondary structure type (A, AB, B).
- Observes that fold rate corr. by SStype depends on ND variant.
- Finds mixing simulated fold rates (peak Es) from different ND variants and exploiting previous result on scaling of edge probability, can strengthen overall fold rate corr. and fold rate corr. by SStype.
Preliminary results:
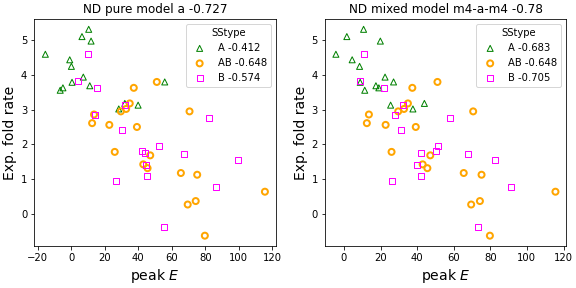
- For the UZ dataset (52 two-state folders), overall fold rate corr. strengthens from -0.72 (previously reported best with the 'a' ND variant) to -0.77 with mixed ND model. Notably, the fold rate correlations by chain fold type are now all significant (p-value < 0.005), when previously they were significant for AB and B chain fold types only (p-value < 0.02).
- For the K dataset (20 non-two-state folders), overall fold rate corr. strengthens from -0.56 (previously reported best with the 'a' ND variant) to -0.65 with mixed ND model. Further, the K fold rate correlation is now stronger than that which can be obtained relatively cost-free with chain length N^{1/2} (-0.57).
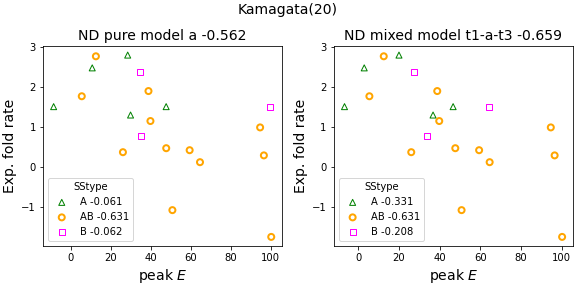
Pure ND models
Pure ND models (craxy, and unscaled versions of acx: ua, uc and ux) implement global node selection and edge formation policies.Mesoscopic investigations
EDS variants: abslv and their folding pathways from native shortcut networks.
Folding pathways from ND generated protein residue networks: $P_{fold}$
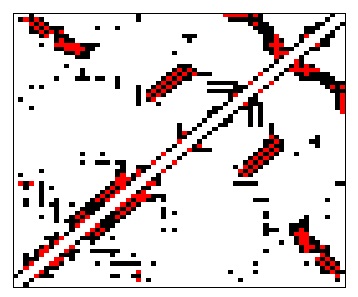
Dashboard to explore contact probability maps as a function of Q
Macroscopic investigations
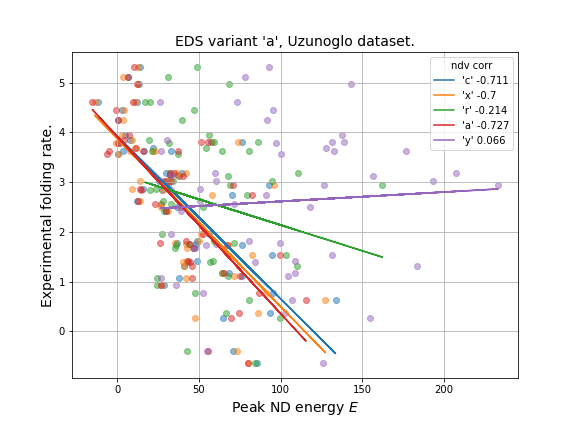
Linear correlation with experimental folding rate: edv=a, ndv=craxy
- Simulated folding rate (peak ND energy): strongest corr. is with 'a' (-0.73).
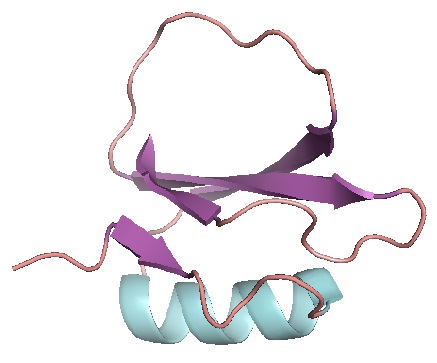
- Contact-Order of native shortcut networks (SCN0).
- Network clustering (C) of SCN0.
Explore edge probability and energy interactions on fold rate correlation
- Scaling edge probability has an impact; it's not just a nice to have.
- There's some wiggle room with energy interactions; MJ potentials not strictly necessary, but good that it also works.
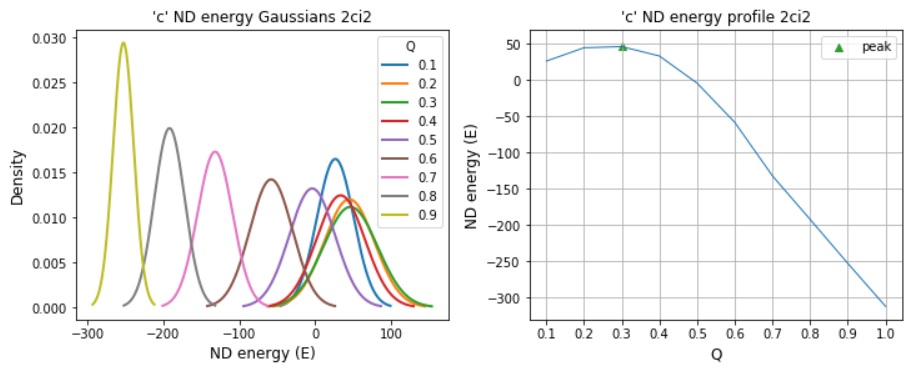
Model ND energy distributions: edv=a, ndv=craxy
Locating TSE networks within the ND reaction coordinate denoted by Q which is fraction of native shortcuts.
The above three features highlight different aspects of a contact: (i) E is particular about amino acid pairing by native and non-native shortcuts, (ii) Contact-Order is sensitive to sequence distance of native shortcuts, and (iii) C considers the arrangement of native shortcuts relative to each other.Microscopic investigations
Bottom: Calculating phi-values with node centrality from ND generated PRNs.
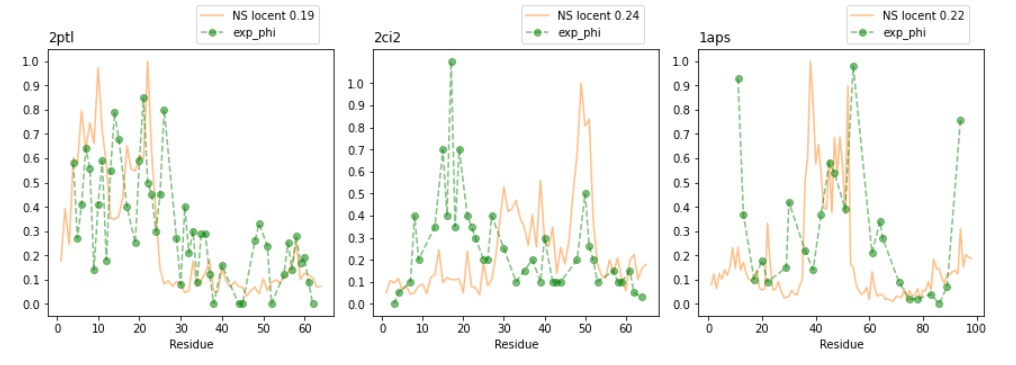
Calculating phi-values from native-state and transition-state PRNs
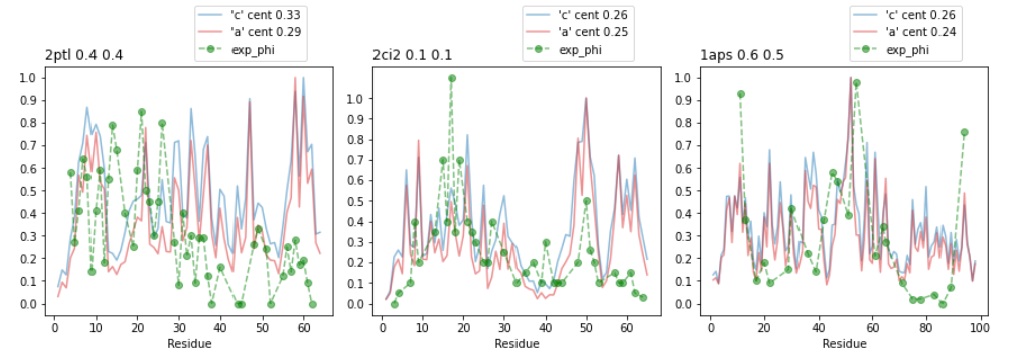
Calculating phi-values from ND PRNs: edv=a, ndv=craxy
Calculating phi-values from ND PRNs with NS normalization
Edge q-labelling reports how ordering PRN0 edges by their avg-q values (otained from ND snaps) can identify TSE PRN0 edges with average AUC = 0.80 over the three biased ND variants a, c, and x.